Tweezer Bottom Candlestick Pattern
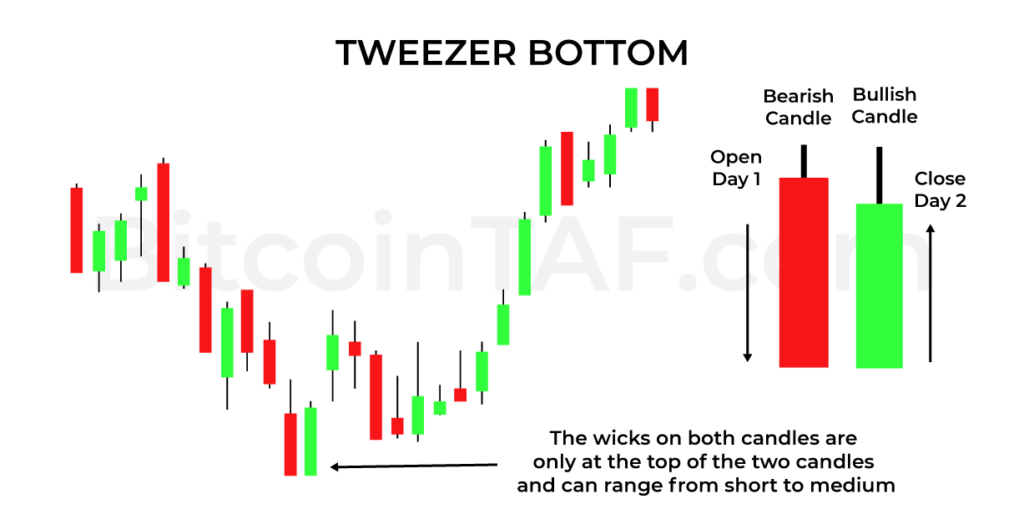
The Tweezer Bottom is also referred to as “Tweezers” amongst traders.
Piercing Line Candlestick Pattern

The Piercing Line usually occurs at the bottom of a downtrend. It indicates the trend might change in a bullish direction. Please note this pattern is not the most accurate and other technical analysis confluence must also be obtained.
Bullish Harami Candlestick Pattern

Bullish Harami Candles usually occur at the bottom of a downtrend. There must be a significant GAP of where the red candle closes, and the green candle opens. It is important to use this candlestick pattern in confluence with other indicators. Very effective with Fibonacci S/R levels.
Bullish Engulfing Candlestick Pattern

Bullish Engulfing Candles usually occur at the bottom of a strong downtrend. The significance of this candlestick pattern is high. It is a strong signal of an impending change in the price direction. Usually, this signals that the second candle is powerful enough to start a new trend.
Bullish Kicker Candlestick Pattern

This pattern is rare but can be one of the most powerful signals available, even better yet, if the pattern occurs in overbought or oversold markets. The noticeable GAP between the two candles means a war between bulls and bears, but the bulls seize control over the market.
Bullish Spinning Top Candlestick Pattern

Regarded widely as showing indecision in the market, one should note that the Bullish Spinning Top is much stronger in a trending market. What is important is that it signals a significant trend change. Usually, the Bullish Spinning Top forms at the bottom of a downtrend.
Dragonfly Doji Candlestick Pattern
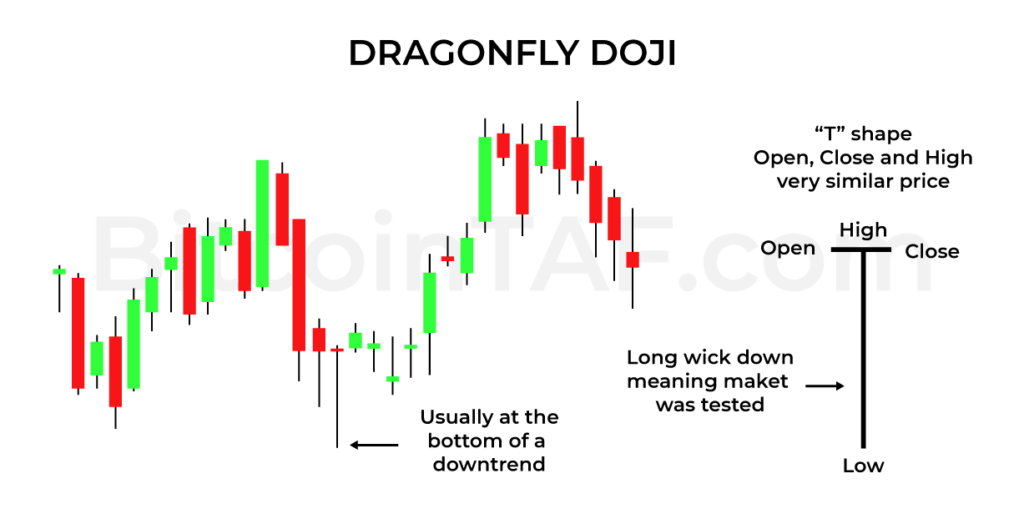
A Dragonfly Doji is usually very rare. The name was formed as the candle represents a dragonfly’s head and body and the trend on both sides represents its wings.
INVERTED HAMMER Candlestick Pattern
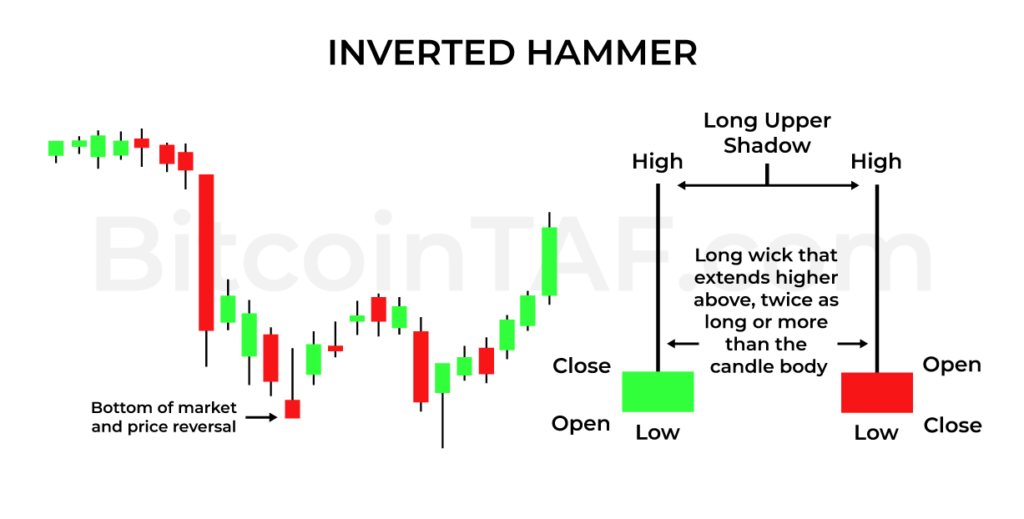
The Inverted Hammer can form on both green and red bodies. The Green Candle is significantly stronger as the close time frame occurs at the candle’s top. Strong Momentum signal.
HAMMER Candlestick Pattern

Hammers usually signal a bottom of a market as well as price reversal, however, it should first be confirmed. Hammers occur in all time frames.