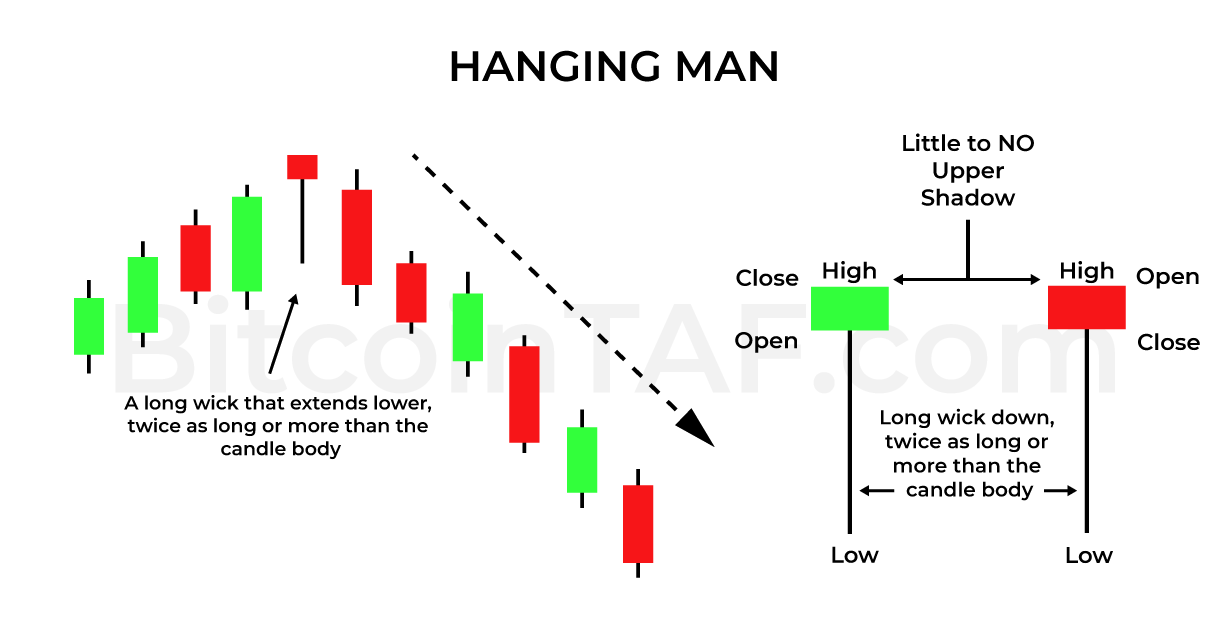
Open, close, and Top of the candle Body are approximately at the same price level.
Candle Wick / Shadow
A long wick that extends lower, twice as long or more than the candle body.
Candle Colors
The Hanging Man can form on both green and red bodies. The Red Candle is significantly stronger as the close time frame occurs at the candle’s bottom. Strong Downward Momentum signal.
Modus Operandi
Hanging Man usually signals the top of a market as well as price reversal, however, it should first be confirmed. Hanging Man patterns occur in all time frames
Fun Fact
The Hanging Man is used with confluence to identify “bull – traps” in the market.